Power Toolkit for Power Apps: A Practical Developer Guide

Writer

Power Platform development often involves a familiar kind of friction: opening one interface to inspect a form, another to test a Dataverse query, another to review plug-in traces, and yet another to investigate solution layers. None of those steps is difficult by itself. The cost comes from repeatedly losing context.
Power Toolkit compresses that loop. Created by Mohammed Khawatme, it is an open-source browser extension for Microsoft Edge, Google Chrome, and Mozilla Firefox. It runs alongside Power Apps model-driven apps and brings form inspection, Dataverse queries, diagnostics, automation analysis, security-context testing, and selected configuration tasks into one workspace.
The right mental model is not “another maker portal.” Think of Power Toolkit as developer tools for the active model-driven app: a context-aware workbench that can examine and, where supported, change what the current user is authorized to access.
Important: Power Toolkit is a community-developed tool, not a Microsoft product. Its capabilities and interface can change between releases. Review the source, requested browser permissions, and your organization’s extension policies before using it—especially in production environments.
What Power Toolkit is—and what it is not
Power Toolkit is designed for developers and advanced makers working with model-driven apps and Dataverse. Its value is immediacy: it uses the current app and environment context, so you can investigate a problem without constantly reconstructing that context in separate tools.
It does not replace:
- the Power Apps maker portal for full solution development and lifecycle management;
- source control, automated tests, or deployment pipelines;
- browser developer tools for general network and JavaScript debugging;
- XrmToolBox, Postman, or other specialist tools when deeper analysis is required;
- formal monitoring, auditing, and operational processes.
Instead, it fills the space between those tools: fast, in-context investigation during development and troubleshooting.
Installation and prerequisites
The extension is available from the Edge Add-ons store, Chrome Web Store, and Firefox Add-ons. The project also documents how to build and load the extension from its GitHub repository.
After installation:
- Open a Power Apps model-driven app.
- Select the Power Toolkit extension.
- Open the toolkit interface and choose the utility you need.
- Confirm that you are connected to the intended environment before running a query or making a change.
Prerequisite: The useful context comes from a supported Power Apps or Dynamics 365 page. The extension is not a general-purpose tool for arbitrary websites. Firefox support requires a compatible Firefox version; check the current project documentation before installation.
A good safety habit is to display or verify the environment URL before every write, delete, activation, or deactivation operation. A browser tab pointed at production can look almost identical to one pointed at development.
1. Inspect the live form instead of guessing
Complex model-driven forms hide a surprising amount of behavior behind tabs, sections, controls, business rules, and event handlers. Power Toolkit exposes that structure while the form is running.
Inspector and form columns
The Inspector presents the form hierarchy as a tree—typically moving from tabs to sections to controls. The form-column view complements it with the attributes attached to the current form and supports live inspection and editing.
This is especially useful when you need to answer questions such as:
- What is the logical name behind this label?
- Is the field hidden, disabled, or simply absent from the form?
- Does the control value match the underlying attribute value?
- Which tab and section contain a particular control?
The practical benefit is simple: you stop debugging the label that users see and start debugging the component that Dataverse and the client API actually use.
“God Mode” and visibility troubleshooting
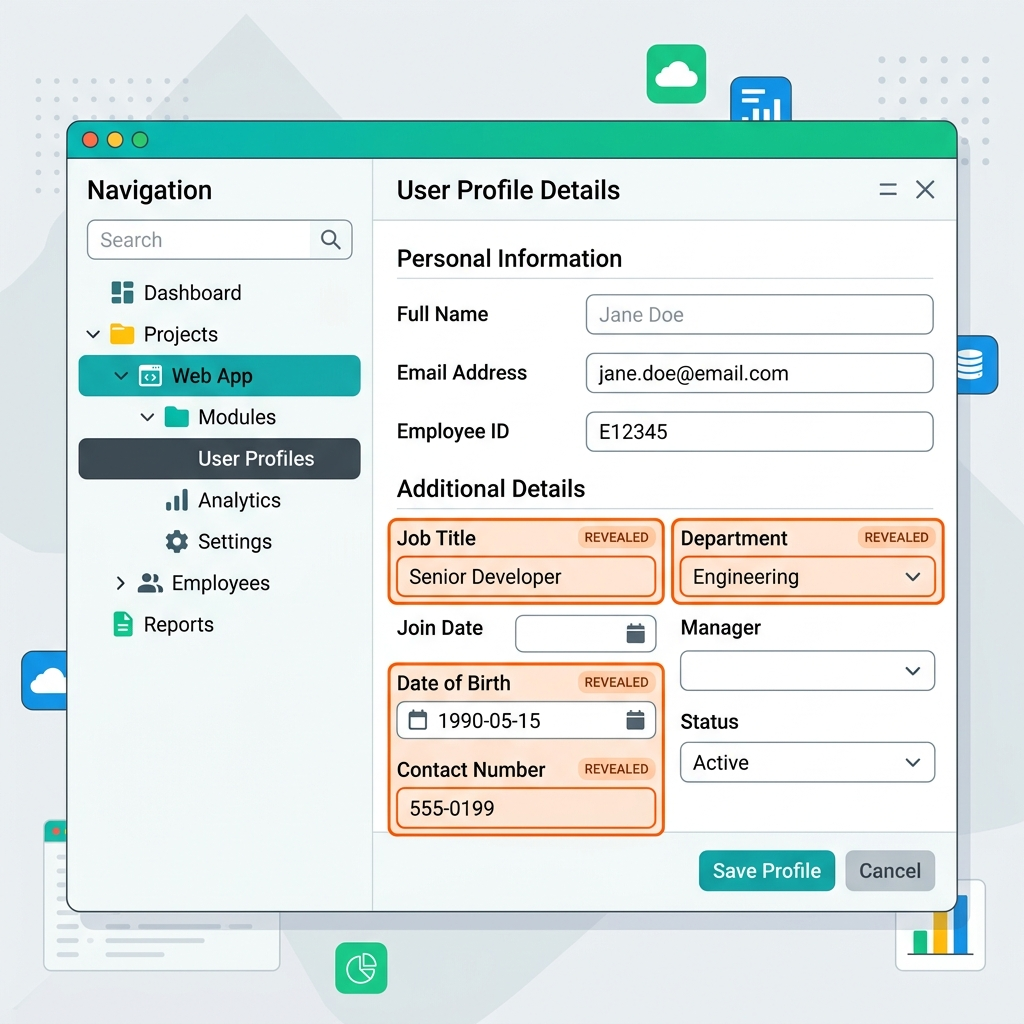
The toolkit can reveal or unlock controls that the form currently hides or disables. This is useful for inspecting data state and diagnosing client-side visibility behavior.
However, this feature should not be confused with elevated Dataverse privileges. Revealing a control in the browser does not grant permission to read or update data that the server denies. It changes the client-side presentation; Dataverse security remains authoritative.
Rule of thumb: Use visibility overrides to investigate form behavior—not to prove that a security design is correct.
Event Monitor
The Event Monitor records form events such as OnLoad, OnSave, and OnChange as they occur. This gives you a timeline of client-side behavior and helps answer a common debugging question: Did my handler fail, or did it never run?
A practical workflow is:
- Clear the event log.
- Reproduce one user action.
- Observe the event sequence.
- Correlate the event with the relevant form handler or business rule.
- Repeat with one variable changed.
That controlled loop is far more reliable than clicking through the form while watching several consoles at once.
2. Use Code Hub as a starting point—not a substitute for understanding
Code Hub provides JavaScript examples for common model-driven app and Dataverse operations. The available patterns include form and UI manipulation, save events, Web API operations, grid work, and navigation dialogs.
Typical examples cover:
- showing or hiding tabs and sections;
- working with execution and form context;
- handling synchronous or asynchronous save logic;
- adding lookup filters and working with business process flows;
- retrieving only required columns and using
retrieveMultiple; - creating, updating, associating, or disassociating Dataverse rows;
- executing bound actions;
- refreshing subgrids, reading selected rows, and responding to subgrid data-load events;
- opening alerts, confirmations, and lookup dialogs;
- utility operations such as logging context information and checking a security role by ID.
The snippets reduce time spent reconstructing standard syntax. Still, treat them as scaffolding. Before using a snippet in production code, review its error handling, asynchronous behavior, supported client API usage, table and column names, and assumptions about the current form.
3. Explore Dataverse data and queries in context
Two of the most useful utilities are the Web API Explorer and FetchXML Tester. They support different ways of asking the same essential question: What data will Dataverse return for this request?
Web API Explorer
The Web API Explorer builds and executes Dataverse Web API requests from the current environment. The project documents support for GET, POST, PATCH, and DELETE, together with query-building assistance and formatted results.
Use it to:
- validate an entity set name or row URL;
- test
$select,$filter,$expand,$orderby, and$topbehavior; - inspect the generated HTTP request;
- view the returned JSON before embedding the call in application code;
- page through larger result sets when the response spans multiple pages;
- test create and update payloads with the current user’s permissions.
For example, before adding an account query to a web resource, you can first prove that the endpoint, selected columns, filter, and response shape are correct. This separates a query problem from an application-code problem.
Caution: POST, PATCH, and DELETE are real data operations. Use disposable test data in a development environment whenever possible.
FetchXML Tester
FetchXML remains important across model-driven apps, views, reporting scenarios, and Dataverse integrations. The tester provides an editor and builder for creating, formatting, and executing FetchXML, including joins and aggregate queries.
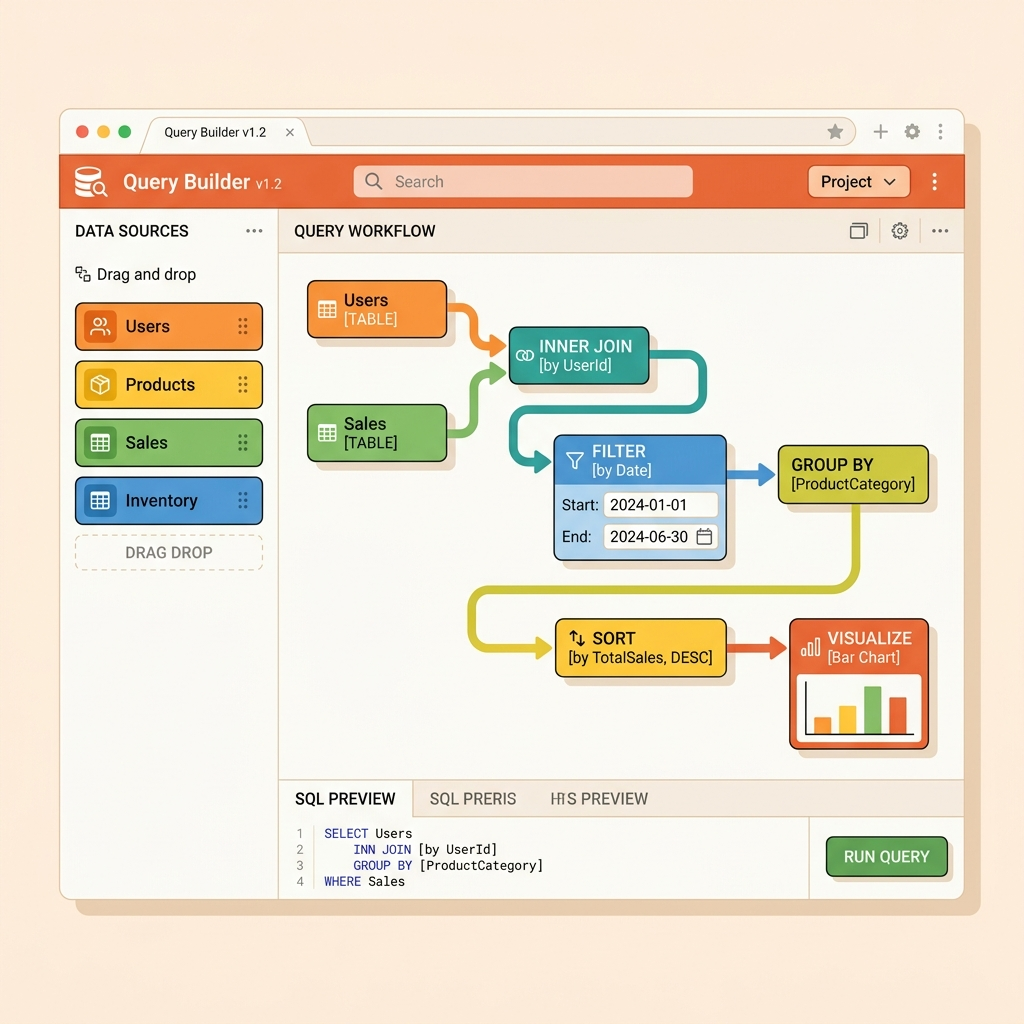
It can also convert FetchXML into several implementation-oriented forms, including QueryExpression, JavaScript, OData, SQL-style representations, Power Automate expressions, and Web API URLs. Conversion is valuable for learning and prototyping, but always verify the generated output: the target query model may not support every FetchXML behavior with perfect equivalence.
A useful progression is:
- Start with the base table and a small column set.
- Execute the query and inspect the rows.
- Add filters and sorting.
- Add linked tables.
- Add aggregation only after the row-level query is correct.
- Convert the final query to the target format and test it again there.
This incremental approach makes malformed joins, aliases, and aggregation errors much easier to isolate.
4. Troubleshoot automation and server-side behavior
Client-side symptoms often originate elsewhere. A slow save may involve a synchronous plug-in. A value that “changes itself” may be controlled by a business rule or automation. Power Toolkit brings several of those signals closer to the form.
Plug-in trace logs and plug-in context
The Plug-in Trace Log viewer supports filtering, searching, and live polling of Dataverse plug-in trace entries. It helps you correlate a user action with server-side execution, exceptions, duration, and trace output—provided tracing is enabled and the current user can access the relevant records.
The Plug-in Context utility can model Target, PreEntityImage, and PostEntityImage payloads and includes support for generating C# unit-test scaffolding for FakeXrmEasy. This does not execute a production plug-in pipeline in the browser. Its value is in making message context concrete and easier to reproduce in tests.
A disciplined diagnostic sequence is:
- Reproduce one operation and note the exact time.
- Filter trace logs to the narrowest useful window.
- Identify the message, table, stage, and plug-in step.
- Compare the target and images with the plug-in’s expectations.
- Reproduce the relevant context in a unit test.
Business rules and form handlers
The automation view brings together business rules and JavaScript event handlers associated with a table or form. This helps reveal overlapping logic—for example, a business rule hiding a field while an OnLoad script tries to show it.
The toolkit can also support editing JavaScript web resources and publishing changes. That is powerful, but direct editing should remain a development convenience. Production changes should still pass through source control, review, testing, and managed deployment practices.
Performance analysis
The Performance view breaks form-loading activity into network, server, and client-side work. It gives you a quick way to identify where the delay is concentrated before moving to specialist diagnostics.
Use the result as a starting signal rather than a complete root-cause analysis:
- A network-heavy result suggests examining request count, payload size, latency, and browser network traces.
- A server-heavy result points toward Dataverse processing, synchronous plug-ins, queries, or other server-side dependencies.
- A client-heavy result suggests reviewing JavaScript, control rendering, form complexity, and event-handler execution.
Performance data becomes most useful when gathered through controlled comparisons: load the same form more than once, change one factor at a time, and compare affected and unaffected users or forms. A single sample can be skewed by a cold browser cache, temporary network conditions, or background activity.
Solution layers
Unexpected behavior is frequently a layering problem rather than a code defect. The Solution Layers view helps identify managed and unmanaged layers on solution components and can expose an active unmanaged customization overriding the intended managed definition.
Use it to answer:
- Which solution introduced the current component definition?
- Is an unmanaged active layer taking precedence?
- Did a later managed layer override an earlier one?
Deleting an active layer can materially change behavior. Inspect first, record what you find, and make destructive changes only through an approved recovery path.
5. Manage flows, custom APIs, variables, and metadata
Power Toolkit also includes utilities that reach beyond the current form.
Power Automate
The Power Automate view lists solution-aware cloud flows and exposes details such as identifiers, owners, state, and dates. Depending on the release and your privileges, it can open flows in Power Automate, activate or deactivate them, delete them, display definitions as a diagram or JSON, and edit the JSON of unmanaged flows.
This is useful when a form operation triggers a flow and you need to move quickly from the user experience to the responsible automation. It is also an area where caution matters: changing a flow definition or state can affect every user of the solution.
Custom API Manager
The Custom API Manager can browse, create, edit, delete, and test Dataverse custom APIs within a solution. It supports API configuration—including binding and processing choices—and can generate invocation examples for JavaScript, C#, HTTP, and Power Automate.
The mental model here is contract first. A custom API is not merely a plug-in with a friendly interface; it is a Dataverse message contract. Define the request parameters, response properties, binding, privilege expectations, and implementation behavior deliberately before generating client code.
Environment variables
The environment-variable view exposes definitions and current values and supports creating or editing them. This is convenient for validating configuration drift across environments.
Remember that an environment variable has more than one relevant concept: its definition, its default value, and any current value for the environment. When troubleshooting, verify which value the consuming component actually resolves.
Metadata Browser
The Metadata Browser provides a searchable view of Dataverse tables and columns. It is useful for confirming logical names, data types, ownership, capabilities, and other metadata before writing code or queries.
Metadata inspection is safer than assumption. A column that looks like text on a form may be a choice, lookup, calculated column, or another type with different API behavior.
6. Test security context without borrowing credentials
Power Toolkit supports impersonation for users who have the required Dataverse privileges. Once a user is selected, tool operations can be executed in that user’s context. The User Context view then helps inspect details such as security roles—including roles inherited through teams—along with organization and session information.
This is valuable for questions such as:
- Can this user retrieve or update the row?
- Is access coming from a direct role, team membership, ownership, or sharing?
- Does a query return a different result under another user context?
- How does the impersonated user compare with your own security context?
- Is a command unavailable because of data access, client-side enable rules, or both?
The interface also surfaces shortcuts for comparing security and command behavior and for opening relevant administration experiences such as the Power Platform admin center or Microsoft Entra. These links accelerate investigation; they do not grant additional permissions.
There is an important boundary: impersonation is not the same as reproducing the user’s entire browser session. It can validate server-side authorization for supported toolkit operations, but it may not perfectly reproduce every personalized setting, browser condition, command-bar rule, or external identity-control outcome.
Best practice: Never ask for another user’s credentials. Use authorized impersonation, test users, and documented test cases—and review audit implications before running write operations as another user.
7. Tune the workspace for a shorter feedback loop
Because the extension contains many utilities, its settings help reduce visual noise. Depending on the current release, you can:
- switch between dark and light themes;
- adjust display preferences such as font size;
- hide, show, and reorder commonly used header actions;
- expose quick actions such as showing or hiding logical names, resetting the form, enabling God Mode, refreshing, and switching theme;
- export and import preferences across browsers or machines;
- copy query and diagnostic results;
- clear browser cache when validating newly published client resources.
Some actions behave differently depending on whether you are on a record form or a list. For example, logical-name overlays and form-specific inspection need an appropriate page context. If a command appears unavailable or produces an unexpected result, first confirm which model-driven app surface is currently active.
The goal is not customization for its own sake. Put the tools used in your normal diagnostic sequence within immediate reach and hide the rest until needed.
A practical end-to-end debugging workflow
Suppose users report that saving an Account sometimes overwrites a value and takes several seconds.
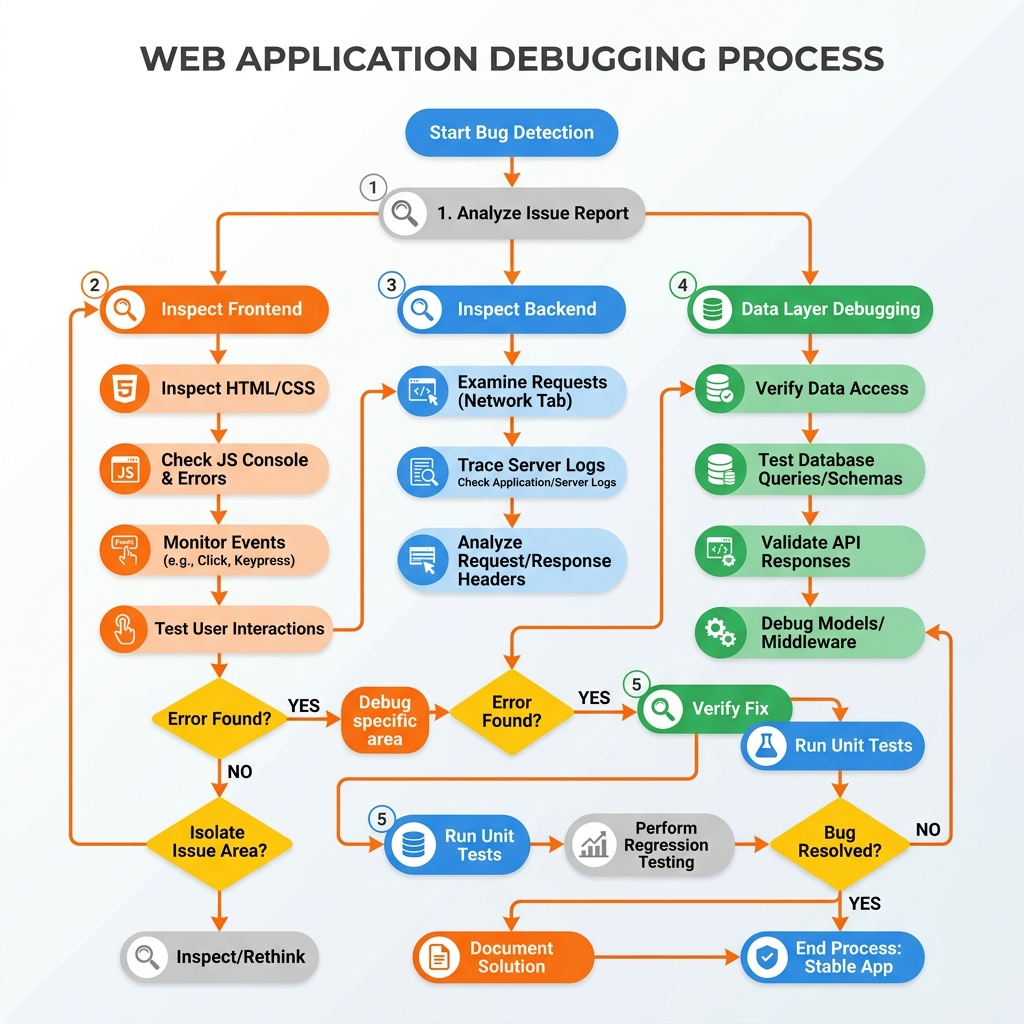
- Inspect the form. Confirm the column’s logical name, current value, visibility, and registered handlers.
- Monitor events. Reproduce the save and capture the
OnChangeandOnSavesequence. - Review automation. Check business rules, form handlers, and relevant cloud flows for competing updates.
- Inspect traces. Correlate the save time with synchronous plug-in execution and review exceptions or long-running steps.
- Validate data access. Use the Web API Explorer to retrieve the row and confirm the final server value.
- Check solution layers. Determine whether an unmanaged customization changed the form, script, or business rule.
- Compare user context. If the issue affects only certain users, repeat safe read operations through authorized impersonation.
- Reproduce in code. Build a focused unit test from the relevant plug-in context rather than debugging only against live data.
That workflow shows the toolkit’s real strength: not any single feature, but the ability to move from symptom to client event, server process, data result, solution state, and security context without repeatedly rebuilding your investigation.
Safe-use checklist
Before using Power Toolkit in a shared or production environment:
- Verify the environment and current user.
- Prefer read-only inspection until the cause is understood.
- Use development data for API writes and deletes.
- Confirm that browser-extension use is allowed by organizational policy.
- Grant only the privileges required for the task.
- Treat impersonation as a privileged, auditable operation.
- Capture existing configuration before changing flows, variables, APIs, or solution layers.
- Move lasting code and configuration changes through the normal application lifecycle.
- Revalidate features after extension updates because community tools evolve quickly.
Final perspective
Power Toolkit is most useful when you treat it as an in-context diagnostic workbench. It shortens the distance between the model-driven form, the Dataverse request, the automation behind the action, the active solution layer, and the user security context.
That does not eliminate the need for specialist tools or disciplined engineering. It makes the first investigation faster and more coherent. For everyday model-driven app development, that shorter feedback loop can be the difference between guessing across five portals and following one evidence-based path to the cause.
References
Read next