Microsoft 365 Copilot Analyst: A Practical Guide to the AI Data Analysis Agent

Writer

Most business data does not begin as a clean model. It arrives as several spreadsheets, inconsistent column names, missing values, and a question that sounds simple until someone tries to answer it.
Microsoft 365 Copilot Analyst is designed for that gap. It is a specialized agent in the Microsoft 365 Copilot app that can inspect attached data, plan an analysis, run Python, generate charts and tables, and explain the result in natural language. Microsoft describes it as an AI-powered assistant for data analysis and compares the experience to having a skilled data analyst available on demand.1
That description is useful, but “virtual data scientist” should not be mistaken for “automatic source of truth.” Analyst can compress a multi-step analytical workflow into a conversation. It does not remove the need to check definitions, assumptions, code, and conclusions.
Analyst also occupies a different niche from Copilot in Excel or conversational experiences built around Power BI and Microsoft Fabric. Excel is often the natural place to work inside a workbook, while Power BI and Fabric are designed for governed models, reusable reporting, and broader analytics workflows. Analyst is useful when the immediate need is simpler: attach source files, ask a multi-part analytical question, and receive a computed report without first building a workbook solution or semantic model.
What Analyst actually is
Analyst is a built-in reasoning agent for Microsoft 365 Copilot. Microsoft made Analyst and its sibling, Researcher, generally available on June 2, 2025, after an earlier Frontier release.2
Its center of gravity is structured-data analysis. You attach one or more files, describe the question, and let the agent work through the task. Depending on the request, it can:
- consolidate information from multiple files;
- calculate descriptive statistics;
- compare categories or periods;
- identify trends, exceptions, and outliers;
- produce tables and visualizations;
- explain its method and summarize findings.
A useful mental model is analyst plus notebook. The language model behaves like the analyst: it interprets the question and plans the work. The Python environment behaves like the notebook: it performs calculations, transformations, and chart generation. The chat response behaves like the briefing: it presents the result in a form that a colleague can review.

This combination is more important than the “chat with your data” label. A language model alone can produce persuasive prose while making arithmetic mistakes. Executing code gives the agent a computational tool for operations that should be calculated rather than guessed.
How the analysis loop works
Microsoft states that Analyst is optimized for advanced data analysis at work, and can run Python while exposing the code to the user.3 The practical workflow looks like this:

- Interpret the request. Analyst identifies the requested outcome, such as a regional comparison, anomaly review, forecast, or visualization.
- Inspect the inputs. It examines file structure, sheets, columns, data types, missing values, and potentially inconsistent formatting.
- Plan the analysis. It chooses transformations, joins, aggregations, statistical methods, and visual forms.
- Generate and execute Python. The agent writes code to perform the work rather than relying only on text generation.
- React to results or errors. It can revise the approach when code fails or an intermediate result exposes a data-quality issue.
- Present the findings. It returns a readable report that can include prose, tables, and charts.
Think of this as an iterative lab notebook, not a single-pass answer. The agent can move between interpretation and computation several times before presenting a result.
Important: Microsoft markets this process using “chain-of-thought reasoning.” Users can inspect the Python code and visible progress, but should not assume that every internal reasoning step is exposed. The reviewable artifacts are the inputs, generated code, outputs, and written explanation.
Why Python execution matters
Python changes the nature of the interaction. Instead of asking a model to estimate totals from a large table embedded in context, Analyst can load the data into a computational environment and calculate the answer. In the source demonstration, the generated code used the pandas library for tabular manipulation, aggregation, and preparation of chart data. The precise libraries and implementation details can vary by task.
For example, a request such as the following contains several analytical operations:
Compare quarterly revenue by region, normalize the result for store count, flag material outliers, and visualize the trend. Explain every assumption.
A credible answer may require the agent to:
- parse dates and numeric fields;
- group records by quarter and region;
- join a store-count table;
- calculate revenue per store;
- define an outlier method;
- generate one or more charts;
- report missing or excluded records.
Those are code and data tasks, not merely writing tasks. The ability to view generated Python is therefore one of Analyst’s most valuable features. It gives a technically informed reviewer a way to check grouping logic, filters, joins, calculations, and chart construction.3
Visible code is not the same as verified code. A script can run successfully and still answer the wrong question. The agent may select the wrong date field, aggregate at the wrong grain, treat blanks as zero, or infer a relationship that the data does not establish.
Accessing Analyst
Analyst is available to users with a Microsoft 365 Copilot license, subject to tenant configuration. Microsoft notes that the agent may be unavailable when an administrator has not enabled it.1
To start an analysis:
- Open
copilot.microsoft.comor the Microsoft 365 Copilot app with your work or school account. - Make sure you are using the Work experience.
- Open Agents in the left navigation and select Analyst. Depending on the interface version and tenant configuration, you may find it among pinned agents or in the agent catalog.
- Start with your own prompt or use one of the interface’s suggested actions, such as analyzing data, finding insights, or creating visualizations.
- Select the + icon and choose Attach content.
- Upload a local file, select cloud content such as a OneDrive file, or choose available work content.
- Review the plan, code, results, and assumptions before using the findings.
The interface can also retain previous Analyst conversations in a history area, making it possible to reopen earlier work. Treat the conversation as part of the analysis record, but preserve important inputs, code, assumptions, and outputs separately when reproducibility matters.
During intake, Analyst may begin immediately or ask a clarifying question when the request or data is ambiguous. A clarification is usually valuable. It is better to define the intended metric or reporting period before the agent builds a polished report around the wrong interpretation.
Microsoft’s current support guidance identifies Excel workbooks and delimited data files as supported data-analysis formats, including .xlsx, .xls, .xlsm, .csv, and .tsv.4 Microsoft 365 Copilot supports other file types for other tasks, but that broader list should not be treated as a guarantee that every format behaves like a structured analytical dataset inside Analyst.
A worked example: from raw sales data to a report
A demonstration referenced in the original source used a 5,000-row “Oregon Trail” sales dataset with raw dimension and fact tables. The prompt asked Analyst to create a report with multiple visualizations, including pie charts.
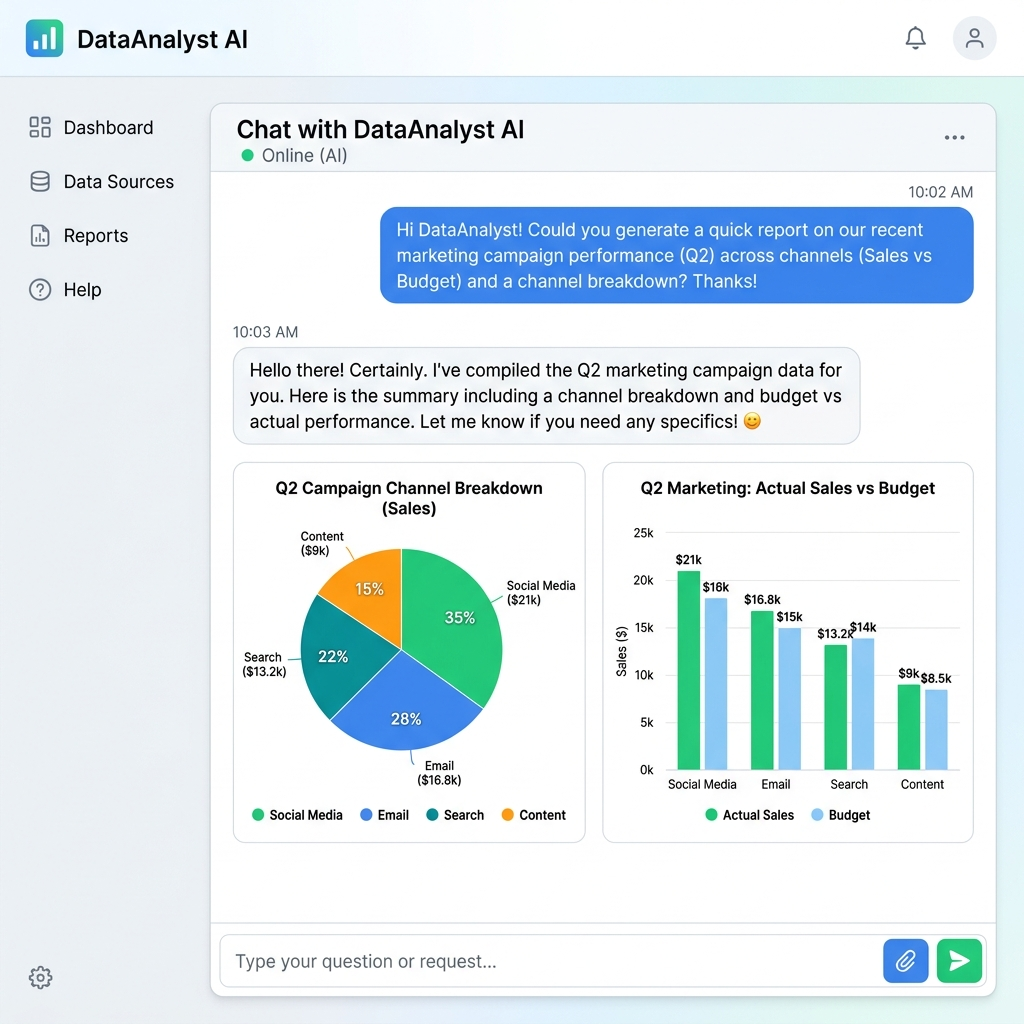
The useful part of this example is not the exact row count or the number of execution steps. It is the lifecycle:
- Intake: The agent inspects the uploaded data and forms a plan.
- Transformation: It writes Python to combine and aggregate the relevant fields.
- Iteration: It adjusts calculations and chart configuration as needed.
- Presentation: It returns charts and a narrative summary in the conversation.
In that demonstration, the interface showed a Python-script indicator and completed 29 visible steps. Those steps included recalculating aggregated data and configuring chart categories, series titles, filenames, and pie-chart angles. Treat the count as an observation from one run, not a fixed product contract. The number of steps, chart behavior, and output format can vary with the prompt, data, and product updates.
The resulting report included high-level measures such as total sales and average profit, time-based views such as sales and profit by year, several pie charts, and a conventional bar chart. It also broke the synthetic dataset down by product category and subcategory, payment method, and salesperson. In the demonstration, chart hover tooltips exposed underlying values, and individual visuals could be displayed as static images or downloaded as PNG files. The presenter also showed that the analysis could be moved into a Word document. These are useful portability features, but because export options can change across clients and releases, verify them in the current interface before designing a reporting process around them.
The source presenter noted that the 5,000-row dataset was intended as a test and expected Analyst to work with larger datasets. The demonstration did not establish a maximum supported row count, performance envelope, or reliability threshold. File size, structure, complexity, and service limits all matter, so test representative files rather than treating row count alone as a capacity guarantee.
The demonstration also attributed Missouri’s strong sales to its historical role as a gateway to the American West. That may be a plausible interpretation, but the sales table alone does not prove causation. This distinction is critical:
| Output type | Example | How to treat it |
|---|---|---|
| Calculation | Missouri has the highest recorded sales | Verify against the data and code |
| Pattern | Sales are concentrated in a small number of regions | Check the metric, filters, and time period |
| Interpretation | Historical geography may explain the concentration | Treat as a hypothesis requiring external evidence |
| Recommendation | Increase investment in the leading region | Evaluate with business context and additional analysis |
Analyst is strongest when it keeps these layers separate. Users should prompt it to do so explicitly.
Prompting for analysis you can audit
A vague request such as “find insights” gives the agent wide discretion. That can be useful for exploration, but it also increases the chance of irrelevant findings or hidden assumptions.
A stronger prompt specifies the objective, measures, dimensions, comparison period, required checks, and output format:
Analyze the attached sales files. Compare net revenue and unit volume by region and quarter. Exclude cancelled orders, but report how many records were excluded. Identify missing values and duplicate order IDs. Use an appropriate chart for trends. Show the Python code, list all assumptions, and separate calculated findings from hypotheses.
Use this compact framework:
- Question: What decision or uncertainty should the analysis address?
- Measure: Which metric should be calculated, and how is it defined?
- Grain: At what level should records be grouped?
- Scope: Which dates, entities, categories, or statuses are included?
- Quality: Which missing values, duplicates, and invalid records must be reported?
- Method: Which calculations or statistical tests are expected?
- Evidence: Which code, tables, and intermediate counts should be shown?
- Output: What chart, summary, or comparison should be delivered?
When the result matters, ask Analyst to include row counts before and after filtering, join match rates, null counts, duplicate counts, and the exact formulas used for derived measures.
Do not “keep the data raw” without limits
One claim in the original article was that users should avoid cleaning data because the agent can recover from messy inputs. That advice is too broad.
Analyst may handle inconsistent delimiters, awkward sheet layouts, or type-conversion errors. This is useful resilience. It is not a substitute for data quality. Some problems are syntactic and repairable; others are semantic and require a human decision.
| Problem | Agent may repair it | Human context is usually required |
|---|---|---|
| Inconsistent date format | Yes | Sometimes |
| Extra header rows | Yes | Sometimes |
| Numeric values stored as text | Yes | Sometimes |
| Missing business definition | No | Yes |
| Conflicting customer identifiers | Partly | Yes |
| Revenue versus bookings ambiguity | No | Yes |
| Biased or incomplete source data | No | Yes |
A better rule is: upload representative source data, but describe known defects and business definitions. Let the agent perform mechanical cleanup, then review what it changed.
Availability, usage limits, and language support
At general availability, Microsoft stated that Analyst was pre-pinned for Microsoft 365 Copilot users, supported eight languages, and shared a limit of 25 combined Analyst and Researcher queries per user per month.2 The source demonstration described that allowance as resetting on the first day of the month. These are service conditions, not architectural properties, and Microsoft can change them.
Because the official announcement is dated June 2, 2025, verify the current limit and language availability in Microsoft’s documentation or your tenant before using those figures for operational planning. The broad Microsoft 365 Copilot language list does not necessarily mean every specialized agent supports every listed language.5
If a quota applies in your environment, use Analyst for work that benefits from multi-step computation. Routine lookups, simple formulas, and basic formatting may be better handled in Excel or standard Copilot experiences.
Security and data protection
Microsoft 365 Copilot operates within Microsoft’s enterprise data-protection commitments. Microsoft states that prompts, responses, and Microsoft Graph data are not used to train foundation models. Copilot also respects the user’s identity and permissions and can inherit controls such as sensitivity labels and retention policies, depending on the subscription and scenario.6
That does not mean every uploaded file is automatically appropriate for AI-assisted analysis. Existing permissions and labels remain important, and users should follow organizational policy for confidential, regulated, or personal data.
A precise mental model is:
- Copilot does not grant new access. It works within the access the user already has.
- Existing oversharing remains oversharing. Incorrect permissions can still expose content to authorized users who should not have had that access.
- Protection does not prove analytical correctness. Security controls govern data handling, not the validity of a calculation.
Limitations: what Analyst does not solve
Analyst lowers the skill barrier for multi-step data work, but several limits remain.
Correct execution is not correct interpretation
Python can faithfully execute a flawed plan. Review whether the selected metric, population, time window, and aggregation grain match the business question.
Correlation is not causation
An observed pattern can support a hypothesis. It rarely proves the reason behind that pattern without a suitable research design and supporting evidence.
Charts can hide weak definitions
A polished chart may still use incomplete records, misleading scales, incompatible categories, or an inappropriate denominator.
Domain knowledge still matters
The agent cannot infer undocumented accounting rules, operational exceptions, or organization-specific definitions reliably. Supply these constraints in the prompt or source material.
Benchmarks show the field is still immature
DABstep, an independent benchmark created by Adyen and Hugging Face, contains more than 450 realistic multi-step data-analysis tasks. Its published evaluation found that even the strongest tested agent achieved only 14.55% accuracy on the hardest tasks.7 This is not a benchmark result for Microsoft 365 Copilot Analyst, so it should not be presented as evidence for or against this specific product. It is broader evidence that autonomous data analysis remains difficult and that expert review is still necessary.
A practical validation checklist
Before sharing an Analyst result, check the following:
- The input files and reporting period are correct.
- Business terms such as revenue, active customer, and churn are defined.
- Filters and exclusions are visible.
- Row counts reconcile before and after transformations.
- Joins do not unexpectedly drop or duplicate records.
- Missing values and duplicates are quantified.
- Calculations reproduce when the Python code is rerun.
- Chart axes, units, denominators, and labels are accurate.
- Findings are separated from hypotheses and recommendations.
- Sensitive data is handled according to organizational policy.
Final perspective
Microsoft 365 Copilot Analyst is best understood as a conversational front end to an iterative data-analysis workflow. Its value comes from combining natural-language planning, Python execution, visual output, and explanation inside the Microsoft 365 Copilot experience.
That combination can make exploratory analysis dramatically more accessible. It can also make an incorrect answer look unusually polished. The right posture is neither blind trust nor blanket skepticism. Use Analyst to accelerate inspection, transformation, calculation, and communication. Then validate the work as you would the work of a capable analyst whose output still requires review.
The most effective question is not “Can the agent analyze this file?” It is: “Can I define the question clearly enough, and can I verify the answer well enough, to use the result responsibly?”
Sources
Footnotes
-
Microsoft Support, Get started with Analyst in Microsoft 365 Copilot. ↩ ↩2
-
Microsoft 365 Blog, Researcher and Analyst are now generally available in Microsoft 365 Copilot, June 2, 2025. ↩ ↩2
-
Microsoft 365 Blog, Introducing Researcher and Analyst in Microsoft 365 Copilot, March 25, 2025. ↩ ↩2
-
Microsoft Support, File formats supported by Microsoft 365 Copilot. ↩
-
Microsoft Support, Supported languages for Microsoft 365 Copilot, updated February 2026. ↩
-
Microsoft Learn, Enterprise data protection in Microsoft 365 Copilot and Microsoft 365 Copilot Chat. ↩
-
Egg et al., DABstep: Data Agent Benchmark for Multi-step Reasoning, arXiv:2506.23719, June 30, 2025. ↩
Read next